Venture capital outperformed DJIA during second quarter
Arlington, VA, October 31, 2014 – Venture capital fund performance continues to be strong across most time horizons as of June 30, 2014, according to the National Venture Capital Association’s (NVCA) performance benchmark, the Cambridge Associates LLC U.S Venture Capital Index®. Although returns were down for the quarter as well as the 1-, 3-, and 15-year horizons, the declines were only slight. The 5-, 10- and 20-year horizons all showed higher returns from the previous quarter. Compared to other benchmarks, venture capital outperformed the DJIA during the second quarter, but was down compared to the NASDAQ Composite and the S&P 500. Venture capital outperformed the other leading benchmarks during the 10-, 15- and 20-year time horizons. However, with the exception of the DJIA during the 1-year time horizon, the DJIA, NASDAQ Composite and the S&P 500 all outperformed venture capital during the 1-, 3- and 5-year time horizons.
“Buoyed by a strong appetite in the public markets for venture-backed companies as well as increased M&A activity, venture capital has performed well over recent quarters and continues to prove its worth as an alternative asset class,” said Bobby Franklin, President and CEO of NVCA. “Although down slightly on a quarter over quarter basis, we are encouraged to see venture continue to outperform all the leading equities indexes across most time horizons. We are hopeful this will translate to solid fundraising figures in the coming quarters, which will provide the capital needed to seed and grow the next generation of great companies.”
“Venture Capital’s strong performance over the past several quarters has delivered net distributions back to limited partners, and renewed interest in the space. Venture funds’ unrealized values have likely also swelled during this time, as private company valuations tend to track the public markets. However, the late and expansion stage index had the largest drop in quarter over quarter performance, pulling in the overall index returns as of June 30, 2014,” said Theresa Hajer, Managing Director, Venture Capital Research at Cambridge Associates.
U.S. Venture Capital Index Returns
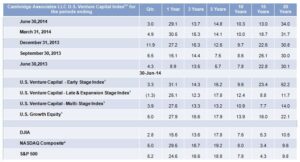
Sources: Cambridge Associates LLC, Dow Jones Indices, Standard & Poor’s, and Thomson Reuters Datastream.
The Cambridge Associates LLC U.S. Venture Capital Index® is an end-to-end calculation based on data compiled from 1,508 U.S. venture capital funds, including fully liquidated partnerships, formed between 1981 and 2014 and the U.S. Growth Equity Index is based on data compiled from 162 U.S. growth equity funds, including fully liquidated funds formed between 1986 and 2014.
¹ Pooled end-to-end return, net of fees, expenses, and carried interest.
*Capital change only.
U.S. Venture Capital mPME Analysis
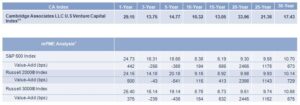
Sources: Cambridge Associates LLC, Frank Russell Company, Standard & Poor’s and Thomson Reuters Datastream.
The Cambridge Associates LLC U.S. Venture Capital Index® is an end-to-end calculation based on data compiled from 1,508 U.S. venture capital funds (963 early stage, 165 late & expansion stage, 374 multi-stage and 6 venture debt funds), including fully liquidated partnerships, formed between 1981 and 2014.
1 Pooled end-to-end return, net of fees, expenses, and carried interest.
2 CA Modified Public Market Equivalent (mPME) replicates private investment performance under public market conditions. The public index’s shares are purchased and sold according to the private fund cash flow schedule, with distributions calculated in the same proportion as the private fund, and mPME NAV is a function of mPME cash flows and public index returns. “Value-Add” shows (in basis points) the difference between the actual private investment return and the mPME calculated return. Refer to Methodology page for details.
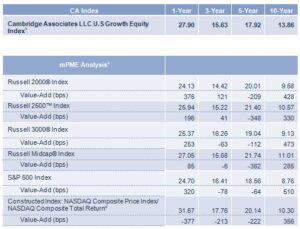
Sources: Cambridge Associates LLC, Frank Russell Company, Global Financial Data, Inc., Standard & Poor’s and Thomson Reuters Datastream.
The index is an end-to-end calculation based on data compiled from 162 U.S. growth equity funds, including fully liquidated partnerships, formed between 1986 and 2014.
1 Pooled end-to-end return, net of fees, expenses, and carried interest.
2 CA Modified Public Market Equivalent (mPME) replicates private investment performance under public market conditions. The public index’s shares are purchased and sold according to the private fund cash flow schedule, with distributions calculated in the same proportion as the private fund, and mPME NAV is a function of mPME cash flows and public index returns. “Value-Add” shows (in basis points) the difference between the actual private investment return and the mPME calculated return. Refer to Methodology page for details.
3Constructed Index: Data from 1/1/1986 to 10/31/2003 represented by NASDAQ Price Index. Data from 11/1/2003 to present represented by NASDAQ Composite.
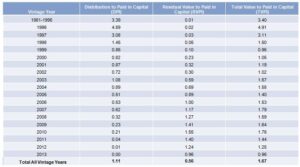
Vintage Year Return Ratios
The following chart lists the ratio between the dollars paid into venture capital funds by limited partners (LPs) and the dollars distributed to them by vintage year. For example, the 2002 vintage year funds have distributed cash of 0.72 times the amount of capital paid in by LPs and the residual value is 0.30 times the paid-in capital; the total value multiple is therefore 1.02 times. It is important to note that the residual value is unrealized and will change as companies exit the portfolio, are re-valued, or are written off. The 2007 and 2010 vintage year funds show the most positive ratio of the last decade, with returns at 1.78 and 1.72 (respectively) the capital contributed by LPs, should those funds realize the value of what remains in the portfolio. More recent vintage years have yet to return significant cash to LPs as most funds do not have the opportunity to begin returning capital until after year five.
Additional Performance Benchmarks
To view the full, comprehensive report, which includes tables on additional time horizons, vintage years, and industry returns, please visit the Cambridge Associates or NVCA websites.
Cambridge Associates derives its U.S. venture capital benchmarks from the financial information contained in its proprietary database of venture capital funds. As of June 30, 2014, the database included 1,508 venture funds formed from 1981 through 2014.