New and Improved Yearbook Features Updated Layout and Expanded Content
WASHINGTON, DC – The National Venture Capital Association (NVCA) today released the 20th edition of the annual NVCA Yearbook, documenting trends and analysis of venture capital activity in the United States from the past year and capturing historical data and information about venture’s role in fueling entrepreneurship in America. The NVCA Yearbook is an annual publication that provides statistics on the size and impact of the U.S. venture industry, investments into startups, capital raised and managed by venture capital firms, and exit activity either thorough an initial public offering (IPO) or merger and acquisition (M&A).
NVCA made several changes to the Yearbook this year, including an updated format and layout of the data, expanding the highlights of NVCA and its role in the entrepreneurial ecosystem, and sourcing the data to PitchBook, now the official data provider of NVCA. In addition to the Yearbook, NVCA is making available a copy of a supplementary data pack in PDF format (available to the public) and XLS format (available only to NVCA members).
“For the 20th edition of the Yearbook, we are pleased to present an updated product that has evolved in both look and feel as well as content,” said Bobby Franklin, President and CEO of NVCA. “The new and improved Yearbook showcases a strong year for the venture capital industry, with the largest amount of capital raised for investment into the next generation of American companies and the second highest amount deployed to U.S. startups in the last 10 years. The Yearbook also revisits what was a busy year for NVCA. From engaging with policymakers on key issues impacting venture capital firms and their portfolio companies to new and improved data and research capabilities, 2016 was a strong year for the organization, positioning us for success in 2017 as we continue to deliver value to our members.”
2016 U.S. Venture Industry At-A-Glance

Industry Statistics
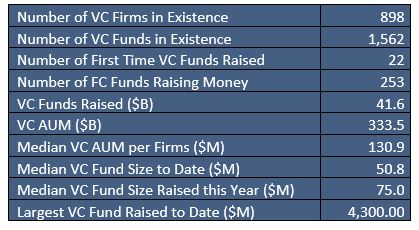
- At the end of 2016, 334 venture firms managed $50 million or less. By comparison, only 68 firms managed $1 billion of U.S. venture capital assets under management.
- In 2016, 2,105 venture firms participated in at least one investment in a U.S.-based startup. Of those, 738 firms participated in startups’ first round of institutional funding.
- The U.S. continues to attract a majority of global venture fundraising, investment, and exit dollars; however, its share has dropped compared to levels a decade ago. The U.S.’s share of global VC investment dropped from 81% in 2006 to 54% in 2016.
Commitments to Venture Funds
- In 2016, 253 venture capital funds raised $41.6 billion, a ten-year high, to deploy into promising startups.
- The concentration of capital managed by fewer funds increased in 2016 as seven funds closed with more than $1 billion in commitments, driving the annual median VC fund size to $75 million (the highest median since 2008).
- Outside of California, Massachusetts and New York, VC fund sizes remained relatively small, with a median 2016 fund size of $23.5 million.
- Many states outside of California, Massachusetts and New York posted year-over-year VC fundraising increases, including Ohio, New Jersey, Tennessee, Missouri, North Carolina and Arkansas.
- Twenty-two first-time funds raised $2.2 billion in commitments last year, the largest amount by first-time managers since 2008.
Capital Deployed to Startups
- More than 7,750 venture-backed companies received $69.1 billion in funding in 2016, representing the second highest annual total—after 2015—in the past 11 years.
- Startups receiving venture funding in 2016 represented approximately 370,000 employees.
- Angel/seed and early stage VC investments accounted for more than 6,600 (81%) of 2016 deal count and $30.7 billion (44%) of venture dollars.
- Software companies attracted the lion’s share of venture investment ($33 billion or 48% of total venture dollars invested) in 2016. Within the software sector, social/platform software companies led the way.
- First-time financings (i.e., first round of equity funding in a startup by an institutional venture investor) dipped in 2016 to 2,340 companies receiving an aggregate of $6.6 billion.
- Venture funding was deployed to startups in all 50 states and the District of Columbia—reaching 226 Metropolitan Statistical Areas and 386 Congressional Districts.
Exit Landscape
- The exit environment for venture-backed companies remained challenging in 2016, with only 39 IPOs completed.
- At the end of 2016, 20 venture-backed companies were in IPO registration, suggesting optimism for a more active IPO window in 2017.
- Disclosed M&As accounted for 82% of the 726 VC-backed exits in 2016, which yielded a total of $46.8 billion in disclosed exit value.
NVCA Highlights
- NVCA worked with the Obama Administration to craft the International Entrepreneur Rule.
- Members testified before a congressional hearing in July on the role of venture in supporting entrepreneurship.
- NVCA honored leaders from the venture industry at its Leadership Gala & Summit in San Francisco in May and appointed Venky Ganesan as Chair of NVCA Board of Directors.
- NVCA held a members-only Public Policy Boot Camp in Washington, D.C. in June with policymakers to learn how member firms could take policy action.
- PitchBook was announced as the official data provider of NVCA in September.
- NVCA wrote a letter to President-elect Donald J. Trump in December outlining key policy priorities to strengthen venture capital and economic growth.
- NVCA released its first ever NVCA-Deloitte Human Capital Survey in December, which assessed the demographic makeup of the venture capital industry.
Download the 2017 NVCA Yearbook HERE. Access the public supplemental PDF data pack HERE. NVCA members, access the members-only supplemental XLS data pack HERE.
